Find, debug and fix a memory leak in Angular
Know the tools to help you investigate memory leaks.
Matthieu Riegler -
Today, I'd like to present to you an issue that has been reported several years ago. A user was concerned by a memory leak when using the animation module. Let revisit the investigation that lead to fixing this issue !
Confirming the presence of a memory leak
We could narrow it down to the usage of the :leave animation.
See here a minimal reproduction:
@Component({
  selector: '[element]',
  template: 'This element is animated',
  standalone: true,
  animations: [trigger(`fade`, [transition(`:leave`, [])])],
  host: { '[@fade]': '' },
})
export class ElementComponent {}

@Component({
  selector: 'my-app',
  standalone: true,
  imports: [NgIf, ElementComponent],
  template: `
    <button (click)="visible = !visible">Toggle</button>
    <div *ngIf="visible" element></div>
  `,
})
export class AppComponent {
  visible = true;
}
Playing with the toggle button whould trigger the leave animation every time the component was removed.
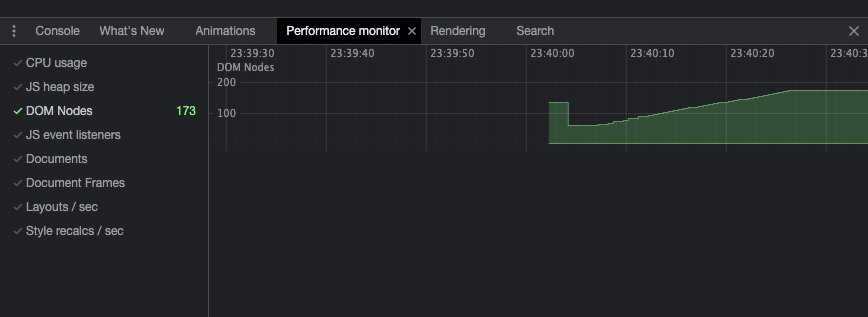
This can be detected with the DOM Nodes counter of the Chromium/Chrome/Edge DevTools Performance Monitor.

In this illustration you can see 2 specific behaviours.
- After the bootstrap, there is a drop in the DOM Nodes count. This is the Garbage Collector (GC) doing his work: cleaning unreferenced DOM nodes.
- Next, I played with the toggle button and increased slowly but surely the number of DOM nodes.
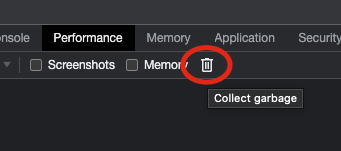
To make sure this is not the GC lagging behind, I triggered it manually from the DevTools.

Finding the origin of the leak
Now that we know that we have an issue, where can we start looking for the culprit ?
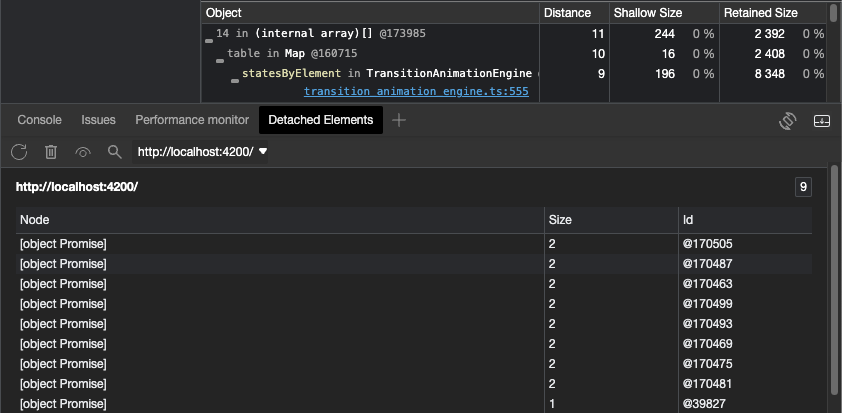
Edge Chromium (Yes at the time of writing, only Edge provides this feature), has a special tool in the DevTools : Detached Elements.
You can hook it in the bottom panel next to the console to investigate Dom Nodes that have been detached from the DOM. Those detached nodes are still in memory because they are still referenced somewhere in the code. This is a good hint at memory leaks.
In our case it looks like this :

The list on the bottom of the screenshot represents each detached node still in memory. When clicking the node ID, we get the stacktrace where this object is referenced.
This stacktrace here is quite explicit, our node is staying confortably in a Map named _statesByElement located in the TransitionAnimationEngine class.
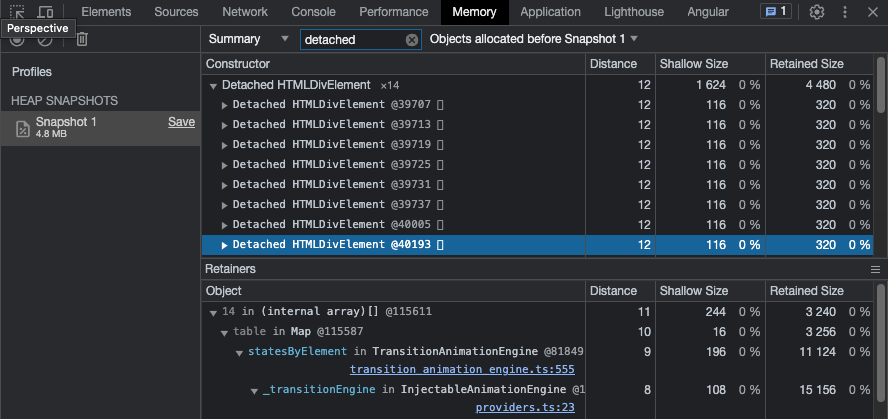
These debugging information are also accessible in Chrome DevTools but less directly. Take a memory heap snapshot of your app, filter to search for "detached" and you'll find a similar list of detacted element in the snapshot.

📝 Note: To investigate the code source of Angular, you can enable the framework source maps in the
angular.jsonsettings like following :"sourceMap": { "scripts": true, "vendor": true },
Without entering too much in the detail of the fix provided in this PR, the solution to our memory leak was to empty the Map at the end of the animation (which wasn't done under certain circumstances).
Without the node being referenced in this Map, the GC can trash it as expected and we no longer have out memory leak !
Et voilà !
I hope have learned something new today, see next time !
Matt.